Showing posts with label Stocks. Show all posts

Sunday, 11 January 2015

Don't be the bag holder

Nice channel on CAM here:


Note the failure at the top end of the channel, followed by a collapse to the lower line. Price has fallen under this and made a retest of the support line. 

CAM could flush through the low here and fall further; or it could create a double bottom and try to get back inside the channel. Either way, the use of technical analysis gives us a clear edge. If you're a serious investor, don't be left holding the bag at the failure of the $75 level.


Monday, 22 December 2014

When to use volume

I don't use volume as an indicator too often as it can distract from the trend at hand, or create a bias in your mind when you see an increase.

The following chart on QQQ though, is an example of when volume can be used to assist your decisions on a market's next direction.


The yellow lines I've marked on the chart are highlighting big volume builds in the stock. It's clear looking at these, that the 'smart money' buys heavily into the bottoms. 

If you look at the October bottom, the volume was well above the average: a good sign that large transactions were building and a continuation of the up-trend was likely. We also got a nice bounce off the 200 moving average here.

Friday, 19 December 2014

My thoughts on the 'Black Swan'


Sorry to disappoint any ballet fans out there, but the 'Black Swan' I talk of here, is the metaphor popularized by Nicholas Naseem Taleb, in his excellent book, "Fooled by Randomness", which was used to describe market risk.

The idea was based on early studies on nature, where only white swans had been discovered. When the discovery of black swans was made, it turned previous thought and analysis on its head.

Taleb used the metaphor to describe events that the market does not see coming. One example of a Black Swan would be the Russian default in 1998, whose effects caused a market crash and the collapse of a Wall St hedge fund; complete with bailouts. The sub-prime mortgage debacle of late 2007, is another situation where previous expectations were flipped upside down. Ratios and risk measures that had created a boom in mortgage lending were suddenly irrelevant and the effects were chaotic.

My thoughts in relation to the Black Swan are based on my experience in the market. In mid-2007, the stock markets and housing markets seemed too-good-to-be-true (they were) BUT, until the Black Swan became clear it was only safe to play the current trends, regardless of your thoughts on the market. I use this only to highlight that when the market is showing extreme exuberance, there is still profit to be made going long with tight downside protection. In 2007, the bullish belief was so great, that the market bounced higher following the collapse of Lehman Brothers: one of the largest Wall St banks with extreme contagion risk.

The present action in the stock markets are similar to the markets of 2007, but until we get our 'Lehman moment', it is not advisable to fight the trend. When the Black Swan comes it will be clear.


Weekly closings - Stocks, Oil, Gold

Stocks

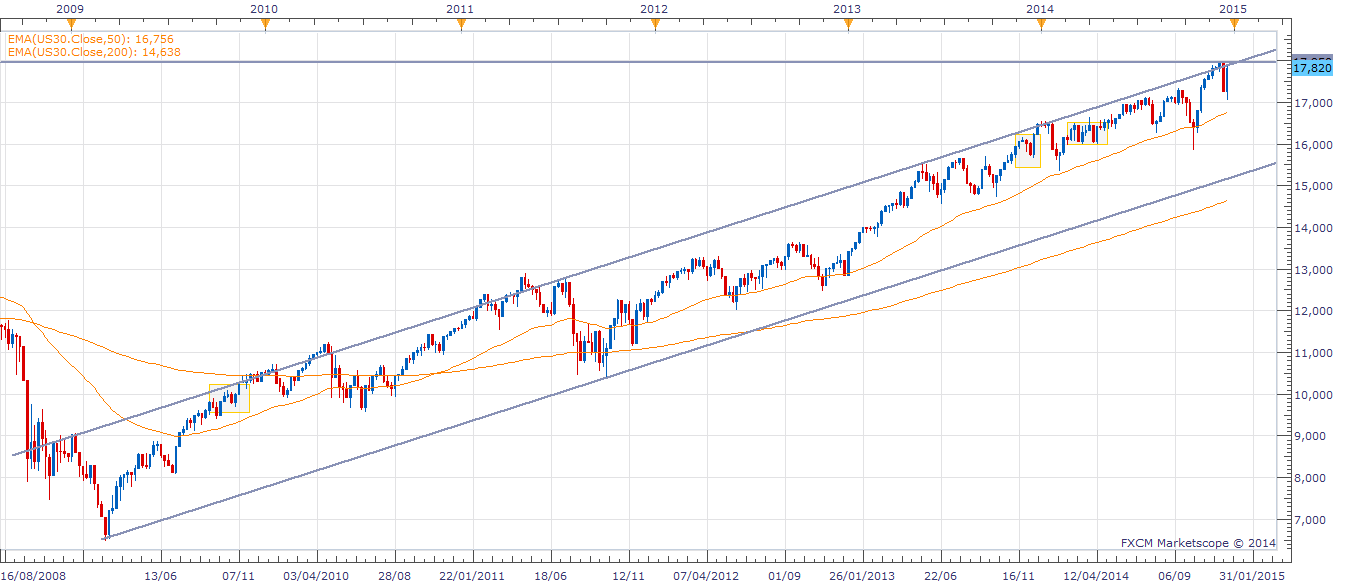
Another strong weekly close has been elected by the Dow bulls and we have approached some key overhead resistance.

The market has closed strongly through 17,800 and now eyes 18,000. Support above 18,000 and we would likely see clear-blue-skies for the equity markets again.


Love it, or hate it, I have written on the subject recently to give some ideas: http://seekingalpha.com/article/2634995-equity-bears-still-dont-get-it

I still don't think we have seen the 'blow-off' style top that accompanies bull markets like this, although, as the NASDAQ approaches it's all-time high I may be proved wrong. There is still the option that if sovereign debt contagion was to happen through Russia, Venezuela, emerging markets, Japan, Europe (large list) then tech may be shunned for 'bellweather' industrial stocks. We watch and wait.

If you think this action is crazy on stocks, understand that markets have exhibited the same types of insanity for over a hundred years or more. Psychology takes over from fundamentals until the top. We will however look back one day and see where the inflection points were. Until then, you have to stay with the trend.

'Don't fight the Fed' but protect the downside on longs.

Oil

Crude Oil has put in a promising bullish close this week and may stabilize/rally from here. Obvious target is to clear $60 and test $70.


I'm still wary of the $40 level but in my previous posts you'll see I talk about price action. Rallies happen in the middle of a basing setup. Market feeling for its lows.

Gold

A disappointing close for gold, with a bearish candle on the week and failure at $1200. This can all change rapidly in such a risky global economy and as the Dow reaches strong overhead resistance, it wouldn't be a surprise to see a top in stocks, rally in gold and oil.


On a portfolio basis, I am looking at oil ETFs and strong balance sheet oil/energy plays that have been unfairly dragged down.

Exxon for example, can be bought around 11-times earnings against Facebook's 70-times. No contest.

I will continue to look for a bottom in gold to test the highs but may come mid-2015.

If I see support on S&P or Dow then I might play ETFs with futures exposure incase of blow-off top mentioned above.

Good luck trading and please buy my book, advertised on the left to build the investment skills that I try to share here.


Thursday, 18 December 2014

Oil charts look ominous

Despite a bounce on OPEC's statement that low oil was "temporary", the chart has fallen back to give a bearish signal. With the stock market rising strongly off the FED announcement and gold looking a little weak also, it's possible we will get another leg up in risk, with a leg down in commodities.


The weekly chart doesn't look any better on crude oil and the levels at $50, and more so $40, look like a potential magnet zone for crude. I wouldn't be surprised to see these levels targeted in the "risk off" move that I mentioned. 


***I went long oil at $60, with an extra position at 55, which allowed me to take the second portion at $60.

I will hold off any other buying now but the lows at $40 would be a strong entry for me. Further lows will ensure that oil stays depressed into 2015 but there are always bounces to take advantage of.

Remember also, that OPEC cut production by 75% in the 1980s and couldn't halt price so awaiting their actions here is also futile. As yesterday and today's rally showed, OPEC created a small opportunity to cut loss or take a small profit,

The 1980s chart is shown below for reference:


If the oil price was to stay depressed through 2015 - 2017 it would do considerable damage to economies and corporations as it did in the 1980s. 


Thursday, 11 December 2014

On ONNN

I posted the following short piece of analysis on On Semiconductor Corp (NYSE:ONNN) recently on Stocktwits:

http://stocktwits.com/message/29920441

The basis of the post was the sharp momentum move in the stock and a quick look at levels.

My analysis was: "O/bt daily but room higher on weekly. 9-9.25 gap key (sits at 50ma also). Buy support there or above 10."

In long hand this was stating that the daily RSI was in overbought territory on the daily but the weekly had room to go higher. I was highlighting that the $9.00 - 9.25 gap was key. If it held, then a push through $10 was possible.

The real advice I was giving was to urge a little caution  at the current level. Many will see a strong move and dive in, but I wouldn't have bought at that level of $9.84. I would rather buy support around $9 or even higher, over $10, if the stock broke out.

The price between $9-10 is actually a bit of a no-man's-land so it is better to put it on a watch list and wait the better price, to adjust your risk more efficiently.

So how did the stock perform?


This is the daily chart of On, 5 days later. As you can see, it's slightly lower than the $9.83 price we could've had. The stock actually closed through $10, a short pullback led to a low volume follow-through which couldn't get above that level again. We now have a strong bearish close back into the 9s. The 50 and 200ma could provide support on bearish continuation so it was right to urge a little caution previously as the close above $10 is looking like a false breakout.

(You can see the overbought condition on the daily chart. I don't always use the RSI as it can be inaccurate for timing but it can add some context to a move).